Why is the Dollar so Strong? Will It Last?
May 10, 2024 First quarter GDP growth was weaker-than-expected at 1.6% compared to an expected 2.5% pace. Part of the shortfall was from the trade component which subtracted 0.8% from growth in that quarter. The strength of the dollar has often been cited as the...

Consumer Sentiment
May 10, 2024 The preliminary estimate of consumer sentiment for May plunged by 9.8 points to 67.4 as consumers worried that inflation might remain higher than expected for a protracted period, and that the Fed might not cut rates at any point in 2024. Surveys of...

Fed Funds Rate
May 10, 2024 . The federal funds rate is the overnight rate that banks charge each other to borrow/lend reserves. Some banks have more reserves than they need. Others (principally large banks) are short of reserves and must borrow from other banks in the system,...

Initial Unemployment Claims
May 9, 2024 Initial unemployment claims rose 22 thousand in the week ending May 4 after rising 1 thousand the previous week. The increase this week seems related to the NYC teachers who had a break and were allowed to apply for unemployment benefits. If so, the...

Early Signs of an Economic Slowdown
May 3, 2024 Economists have been waiting for the economy to slow for more than a year. Their dire warning of a recession last year proved completely off base as firms continued to hire workers and consumers continued to spend, but perhaps the economy is finally...

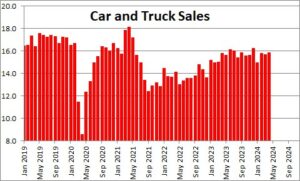
Car and Truck Sales
May 3, 2024 Unit car and truck sales rose 1.1% in April to 15,736 thousand after having fallen 0.9% in March The supply challenges that had curtailed car sales for more than two years has ended. The supplier delivery component of the purchasing managers' index...
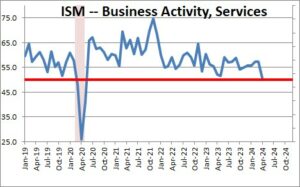
Purchasing Managers Index — Nonmanufacturing
May 3, 2024 The Institute for Supply Management not only publishes an index of manufacturing activity each month, they publish two days later a survey of service sector firms. The business activity index plunged 6.5 points in April to 50.9 after rising 0.2 point...
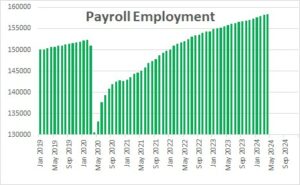
Payroll Employment
May 3, 2024 Payroll employment for April climbed by 175 thousand in April after jumping by 315 housand in March and 226 thousand in February. In the past three months the average increase has been 242 thousand. The employment gains remain sizeable. It appears...
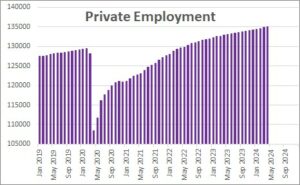
Private Employment
May 3, 2024 Private sector employment for May climbed by 167 thousand in April after jumping by 243 thousand in March and 181 thousand in February. In the past three months the average increase has been 197 thousand. The employment gains remain sizeable. It...
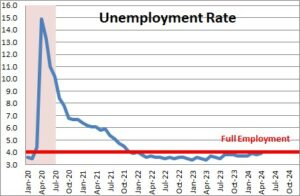
Unemployment Rate
May 3, 2024 The unemployment rate rose 0.1% in April to 3.9% after having fallen 0.1% in March In April the labor force rose by 87 thousand.. Employment rose by 25 thousand. As a result, the number of unemployed workers rose by 63 thousand and the unemployment...
Follow Me